Insights
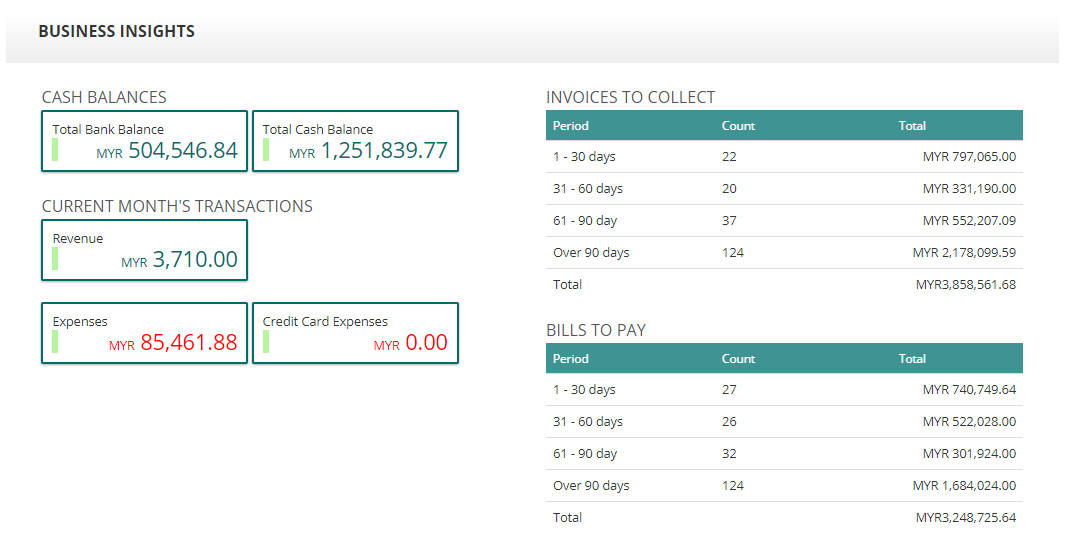
Insights is a page where you can oversee all your business activities and financial health.
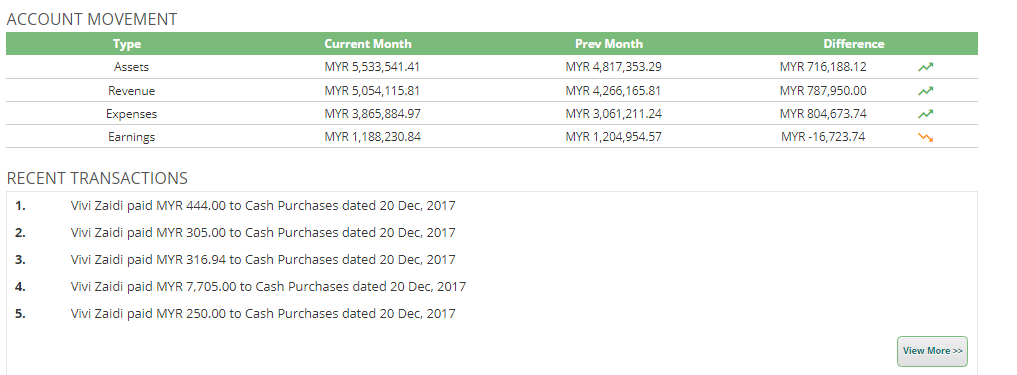
It provides you real time information including your financial position, invoices to collect, bills or invoices to be paid, account movement and recent transactions.
You will be able to monitor your business activities with just a click of a button without the need to do thorough checking throughout the system.
Financial Reports
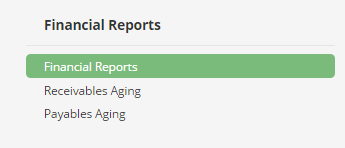
This function provides Finance department a set of standard Financial Reports to view company’s financial health. To view the financial reports, you may go to Accounting >> and click on Financial Reports
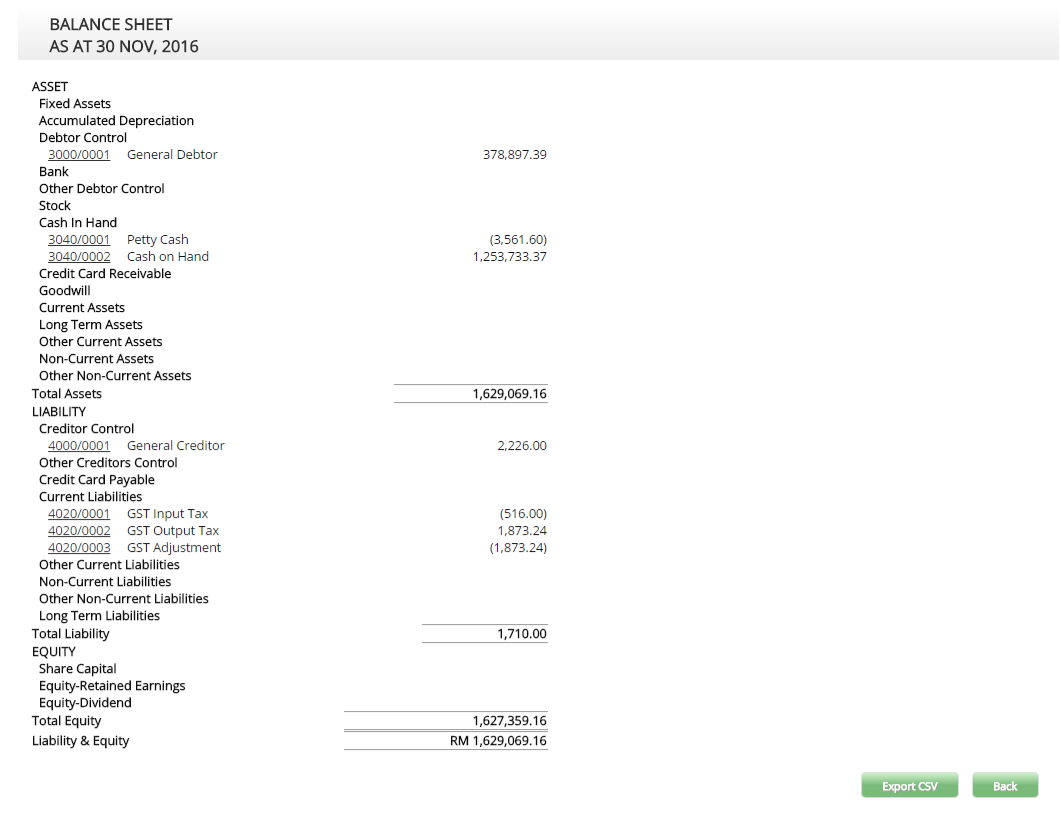
Balance Sheet
- The balance sheet represents the financial position of the business as at a particular date. This report is very commonly used by accountants to present the condition of the company’s financial standing to the owners of the company or the investors.
- With this report, accountants and business owners are able to see a snapshot of the company’s financial position and make analysis as required. The system will automatically calculate the amounts from the opening balance right up to the selected date. This calculation is based on GAAP. Assets = Liabilities + Owner’s Equity.
- Detailed Report View provides the company balance sheet in details such as the last date of the previous year along with each month of the current year balance sheet figures.

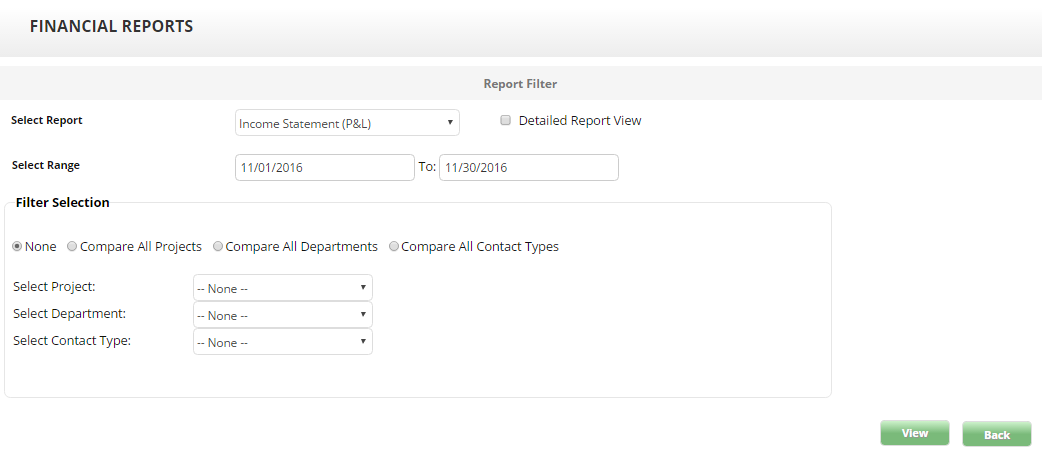
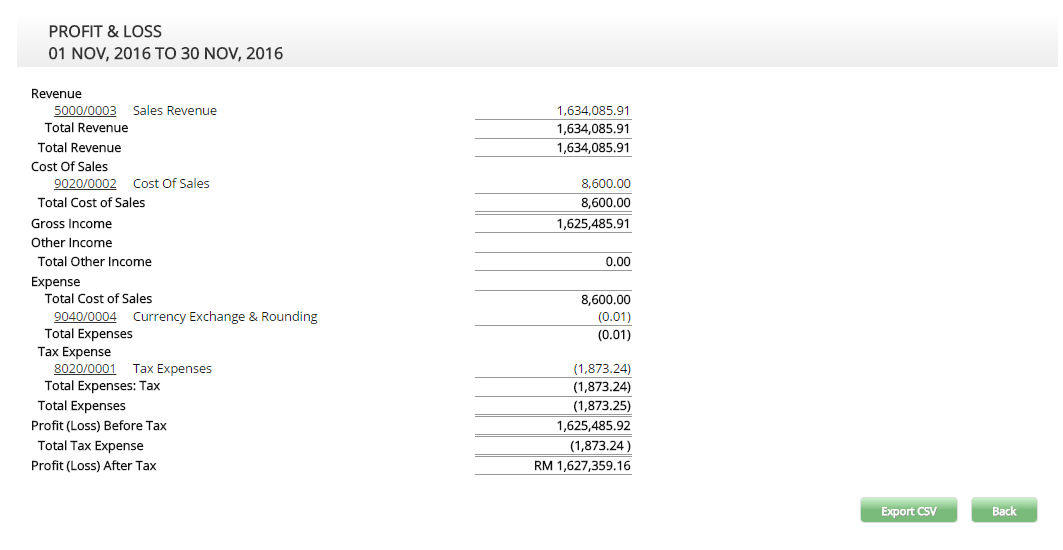
Income Statement
- The income statement, also known as profit and loss (P&L) provides business owners with information regarding the profitability of the company. The income statement can be presented from any date range required. The system will automatically calculate the Revenues and the Expenses of the company based on the start and the end date selected.
- The date ranged can be selected to present the income statement for a whole month, quarterly or yearly. The total revenues will be calculated and a Net Income/Loss for the date range selected will be present.
- Detailed Report View provides the company income statement in details of each month for the current year.
- Income statement report has been defined further by allowing users to select, filter and generate reports for departments, projects and contact type. Users can choose to make comparison within the selected departments, projects or contact type or to generate individual report.


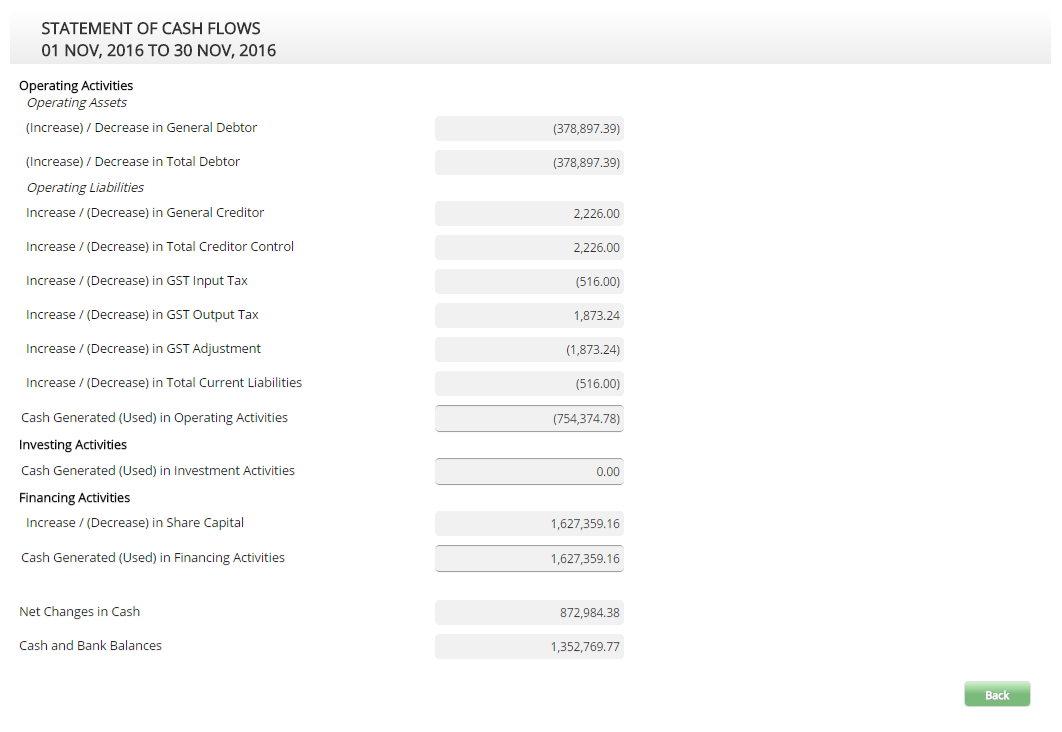
Cash Flow Statement
- The cash flow statement is a report which provides the movement of money through the company for a selected period. The cash flow statement provides information on operating activities, investing activities and financing activities of the organization.
- Business owners and accountants are able to use this report to analyze the liquidity of the company. Banks may use this report when determining loans or credit. Potential investors will also find this report useful in the decision making.

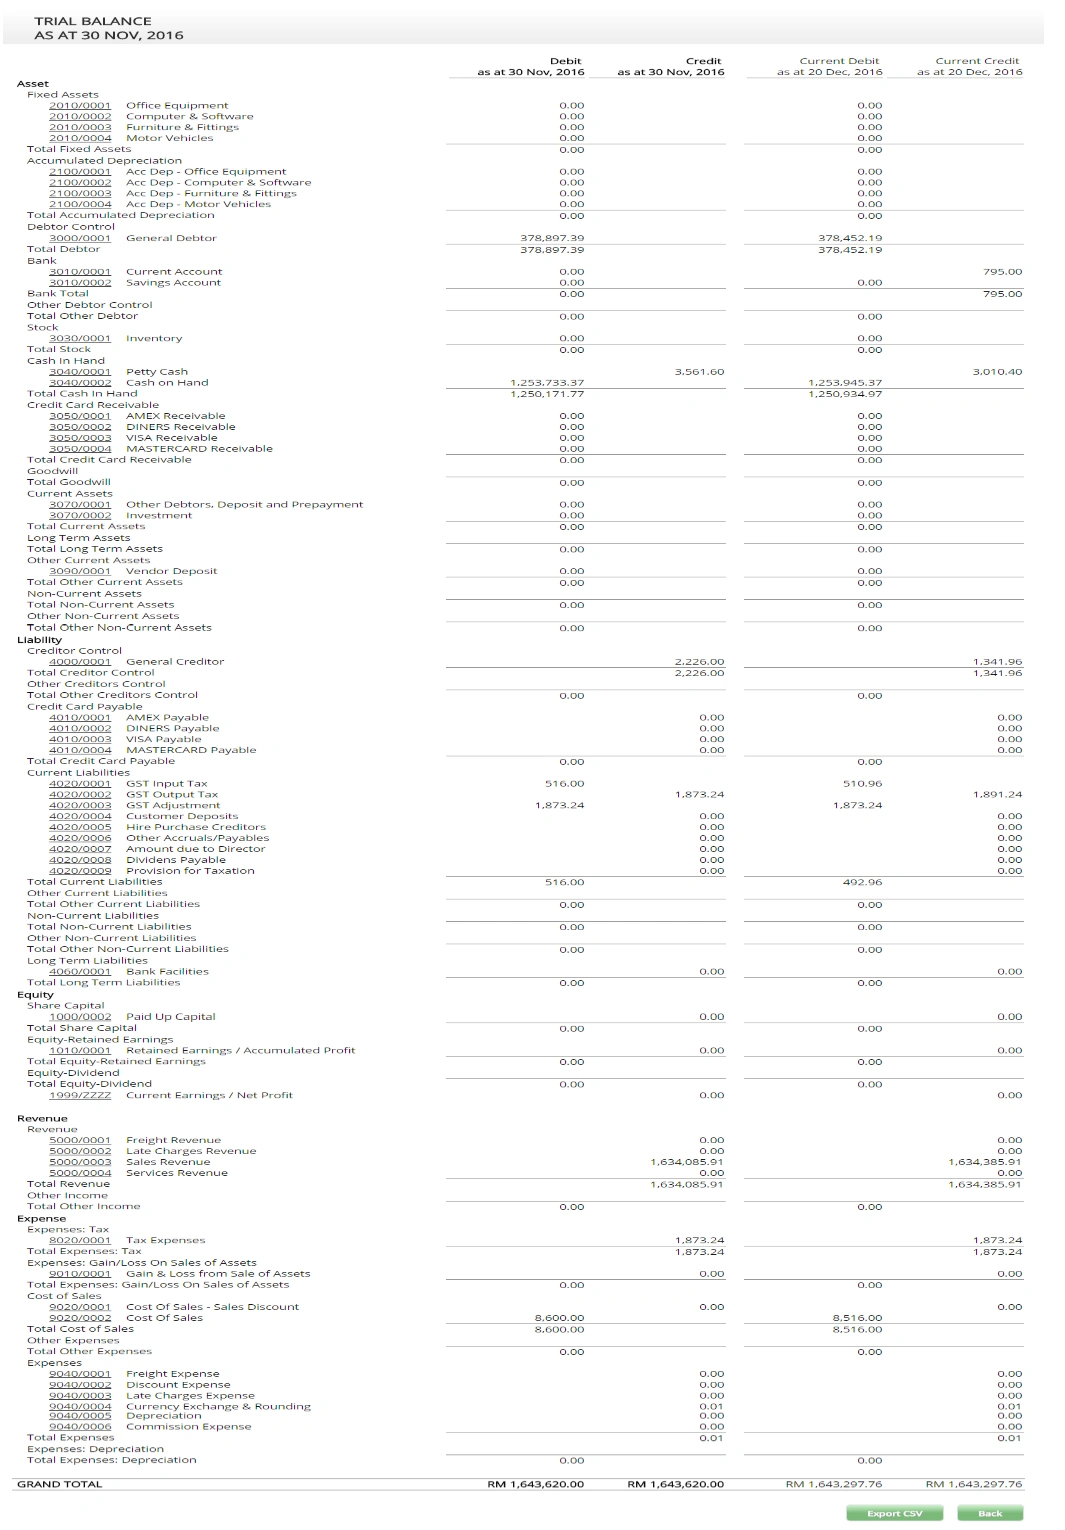
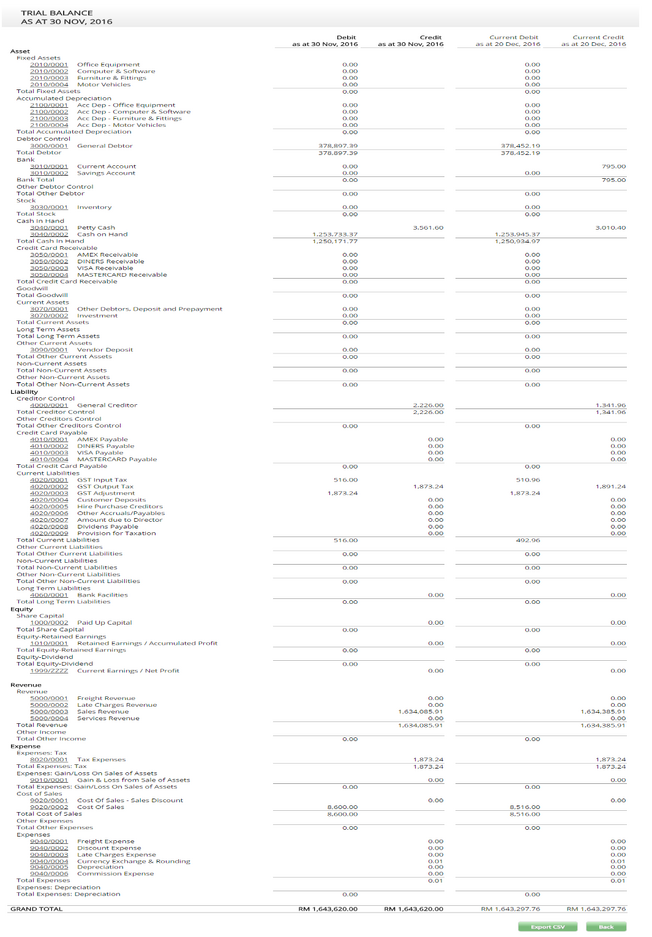
Trial Balance
- The trial balance report served the purpose of double entry system for accountants and bookkeepers; to prove that the total debit balances in the accounts equal to the total credit balances.
- he system has in-built mechanisms and calculations to handle double-entry automatically, therefore trial balance will undoubtedly remain balanced.
- For the purpose of audit and accounting requirements, the trial balance can be produced for any specified date. The trial balance will generate report for a specific date or of today (the day the report is generated). This is so the users can make comparison of the specific date with the current date.
Transactional Trial Balance
- The transactional trial balance report served the same purpose as the above trial balance, however, it allows users to select and compare trial balance within two specific dates.
- Select two specific dates for the trial balance. The report will showed specifically the trial balance of the dates, side by side so that it will easier for the users to make comparison of the two dates.

Account Receivables Ageing Report
- The account receivables ageing report list the customer who’s Invoices are unpaid or partially paid within the agreed payment terms. The report segmented past-due Invoices by number of days and customers.
- Ageing Report can be view via Reports >> click on Receivables Aging. Users may filter the report by selecting customer that they would like to send the end-of-month ageing statement to.
- Select the Receivables as of Date – the system will use this date as the starting point for calculating and categorizing the ageing.
- Select Age by Invoice Date – the system will use the Invoice date to calculate aging classifications. Do note that Invoices within payment terms will not appear in the 0-30 classification.
- Select Age by Payment Terms –the system will user the payment terms to calculate aging classifications. Do note that Invoices within payment terms will fall under the 0-3- classification.
- Click View Report button.
Account Payable Ageing Report
The account payable ageing report list the vendors who’s Invoices are not yet paid or partially paid within the agreed payment terms. The report segmented past-due Invoices by number of days and vendors.
- Ageing Report can be viewed via Reports >> click on Payable Aging
- Select Vendor if you wish to view for a specific vendor or View All by leaving it unselected
- Select the Payable as of Date – the system will use this date as the starting point for calculating and categorizing the ageing
- Select Age by Purchase Date – the system will use the Invoice date to calculate aging classifications. Do note that Invoices within payment terms will not appear in the 0-30 classification.
- Select Age by end of Payment Terms –the system will user the payment terms to calculate aging classifications. Do note that Invoices within payment terms will fall under the 0-30 classification.
- Click View Report button.

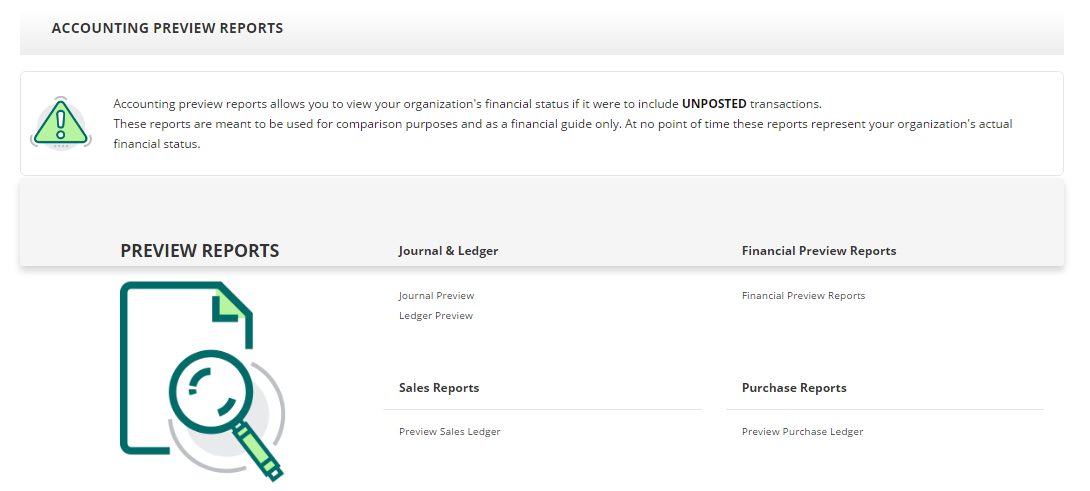
Accounting Preview Reports
Accounting preview reports allow you to view your organization's financial status if it were to include UNPOSTED transactions.
These reports are meant to be used for comparison purposes and as a financial guide only. At no point of time these reports represent your organization's actual financial status.
To view the preview reports, go to Reports >> click on List of Reports Available for Preview

Foreign Exchange Gain/Loss Declaration Report
To view the previous foreign exchange gain/loss that you have declared, go to Reports >> Financial Reports >> Foreign Exchange Gain/Loss Declaration.
Select date range that you would like to view.
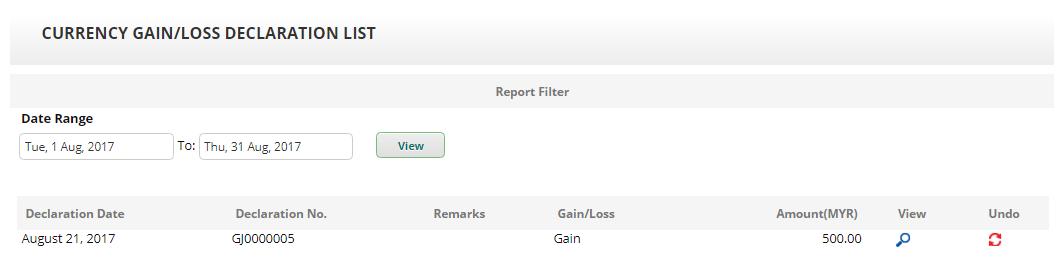

The system will showed the currency declaration list along with the declaration number, amount, and option to view or undo.
The report generated will showed in details the transactions that you have selected for that particular declaration.
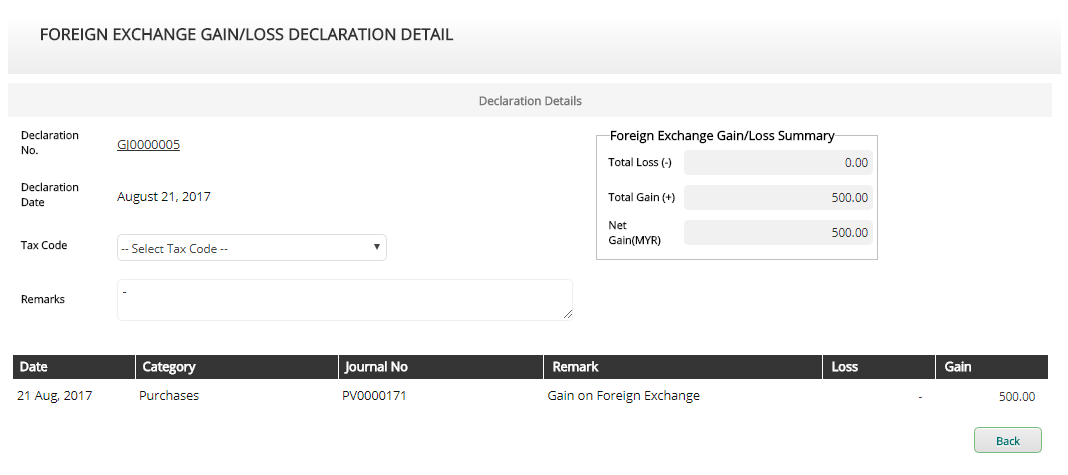

Sales Reports
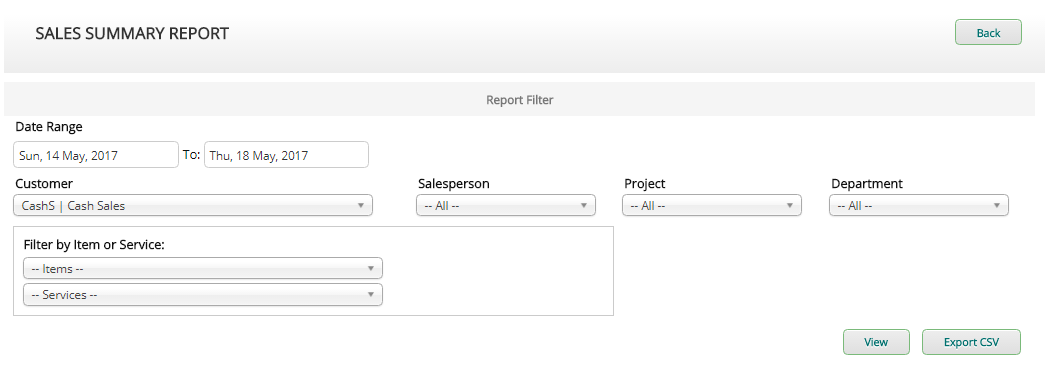
Sales Summary
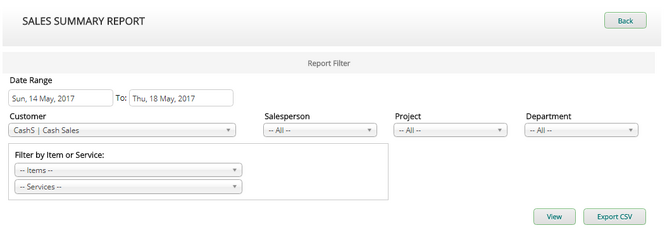
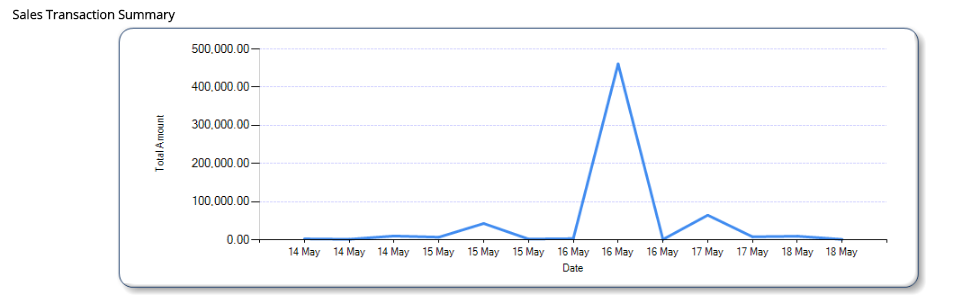
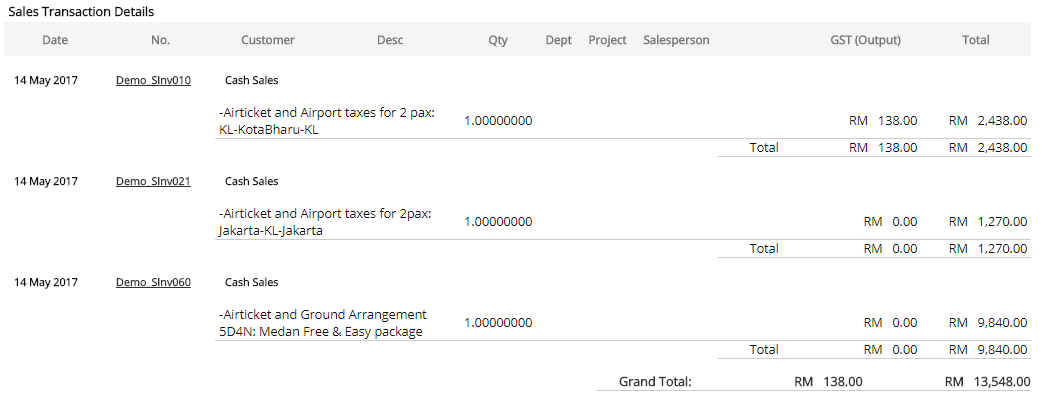
Sales summary is a powerful tool which aids you to search for specific transactions based on a required set of filters. The report generated provides valuable information which can help you analyze your Sales transactions
Select a date range of the transaction
Other filter options available are Customer, Department, Sales Person, specific Project and Store.
Clicking View button without any other filters will result in a large range of data. It is advisable to limit the data range. A large data range will yield many transactions which will naturally take time for the system to search and display them.


Click Export CSV button to export the data to excel sheet
Sales Ledger
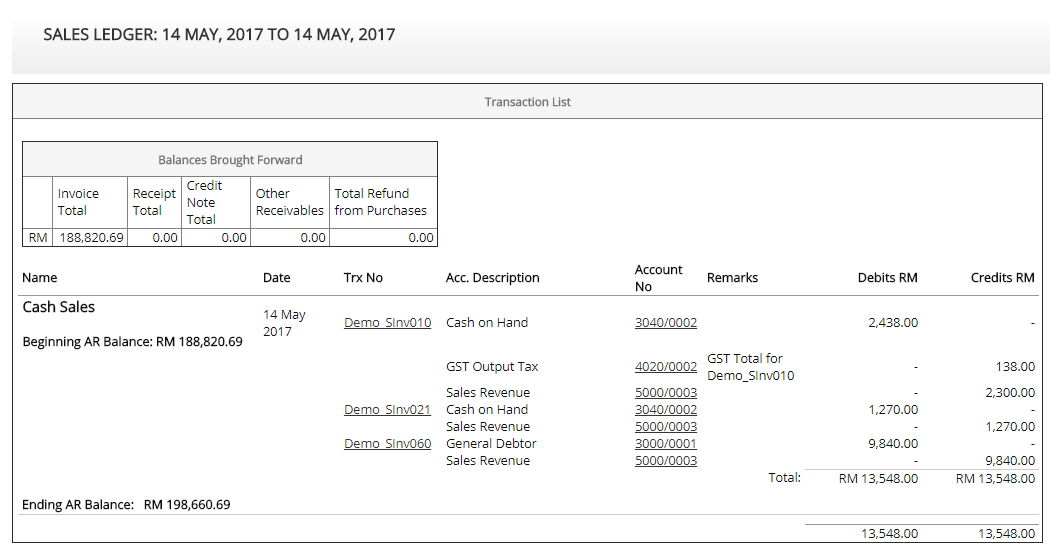
The Sales Ledger provides all transactions involving the selected customer ordered by the selected date range. Ledger value is derived from journals and will show an individual account movement.
Move your mouse to Report >> Sales Report >> click on View Sales Ledger
Select Customer from the dropdown list
Select Transaction Date Range – this is the start and end date to focus on
Click View Ledger button

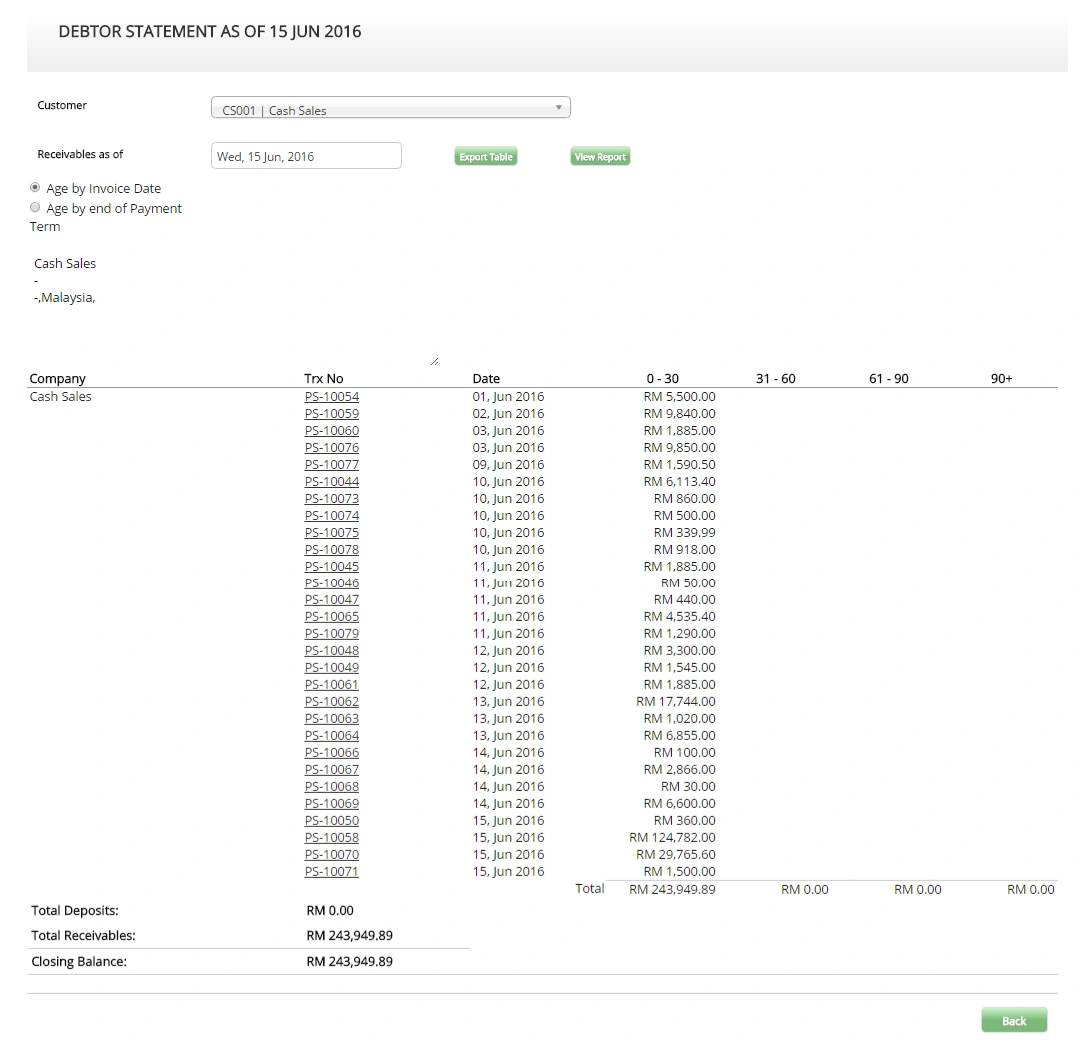
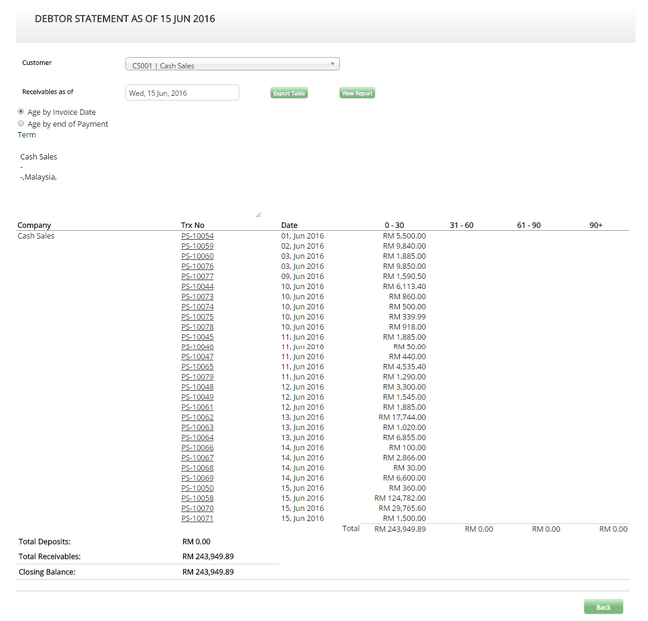
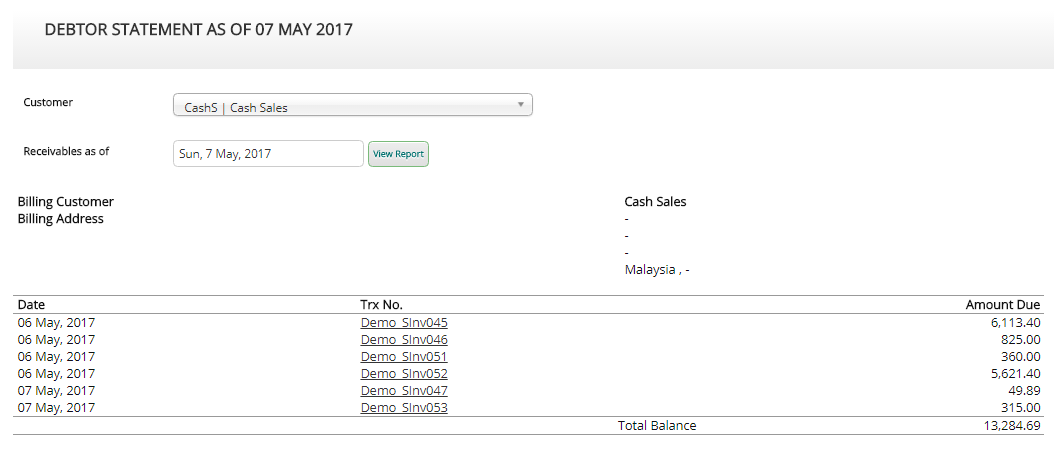
Sales Statement (Debtor Statement) View
This statement provides Customer’s purchase and payment movement for selected date range. This statement summarizes total balance brought forward for each customer since day 1.
To view Sales Statement, move your mouse to Reports >> Sales Report >> Click on View Debtor Statement
It allows user to view a statement of accounts and Sales transactions related within a selected date range
Historical Sales related transactions totals are also displayed for reference purposes

Customer Deposit Balance
This report will shows balance of the deposit which has not allocate.
- Go to Reports >> Sales Reports >> Customer Deposit Balance
- Select the customer
- Select the transaction period
- Click View
Purchases Reports
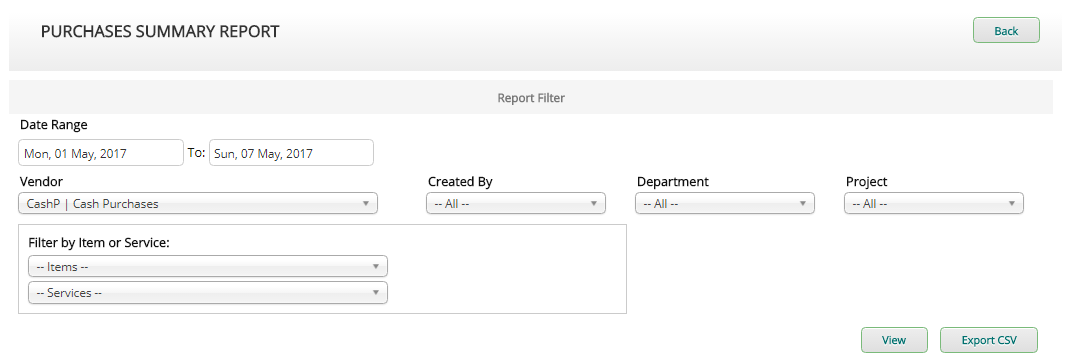
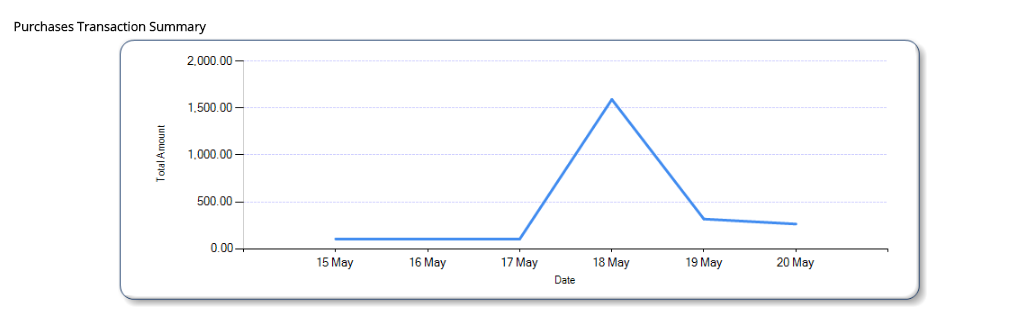
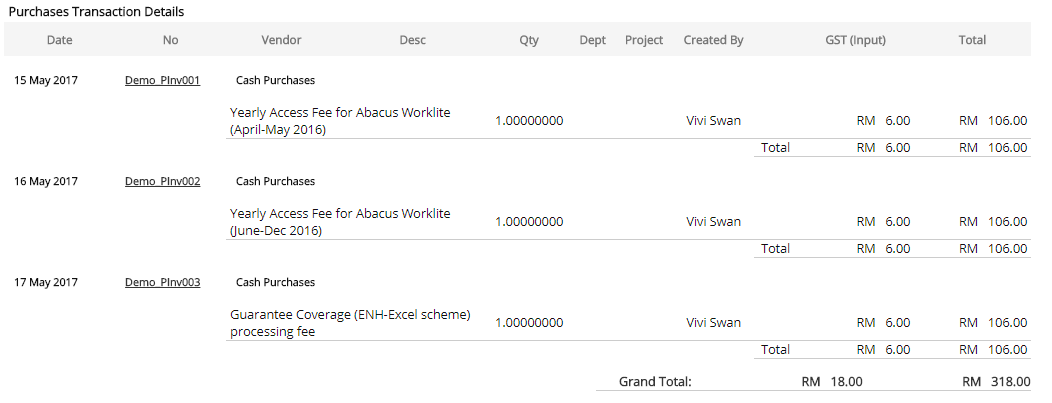
Purchases Summary
The summary is a powerful tool which aids you to search for specific transactions based on a required set of filters. The report generated provides valuable information which can help you analyse your sales transactions based on Purchases Transaction Summary (in graph format) and Purchases Transaction Details (as per transaction line item)
Move your mouse to Reports >> Purchase Reports >> click on View Purchase Report

Select a Date Range of the transaction.
Select Vendor if you wish to view for a specific vendor or View All by leaving it unselected (Department and Project are Option and not applicable to Swan)
Other filter option available is Filter by Item or Service. You may narrow down your summary report to view a specific Item or Service.
Click View button without any other filters will result in a large range of data. It is advisable to limit the data range. A large data range will yield many transactions which will naturally take time for the system to search and display them.


Click Export CSV button to export the data to Excel Worksheet.
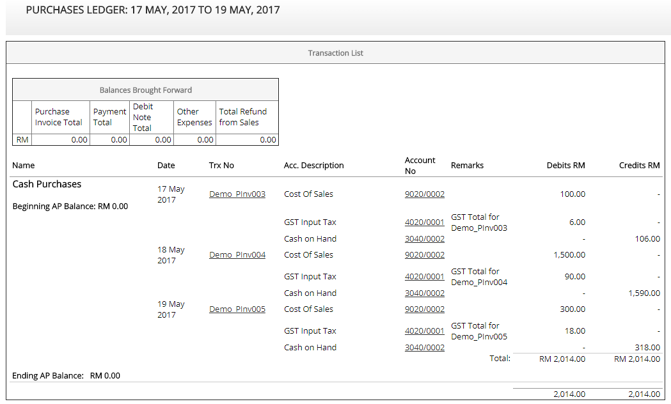
Purchases Ledger
The purchases ledger provides all transactions involving the selected vendors ordered by the selected date range.
Move your mouse to Reports >> Purchase Reports >> click on View Purchase Ledger
Select Vendor from the dropdown list
Select a date range – this is the start and the end date to focus on
Click View button

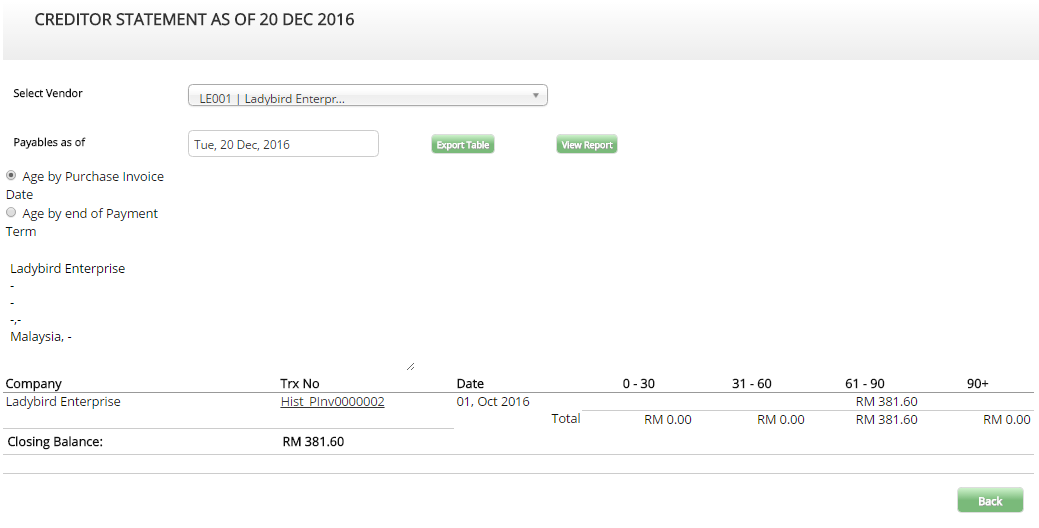
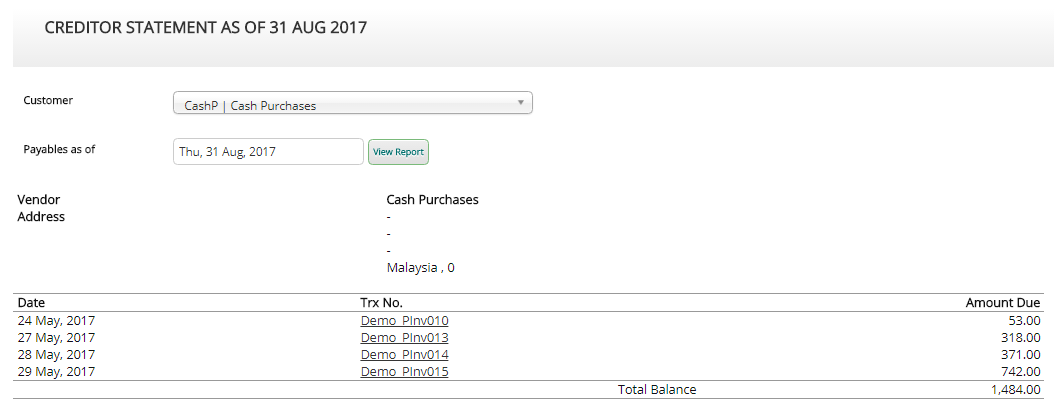
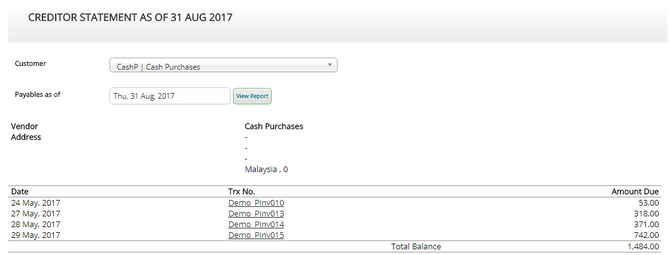
Creditor Statement
This statement provides the company's purchases and payment movement for its supplier.
This statement summarizes total balance brought forward for each supplier from day 1 until the selected date.
To view Purchase Statement, move your mouse to Reports >> Purchase Reports >> View Creditor Statement.
It allows user to view a statement of accounts and related purchase transactions. You can choose either to view all suppliers or a specific supplier within the selected.
Historical Purchase related transactions totals are also displayed for reference purposes.
Vendor Deposit Balance
This report will shows balance of the deposit which has not allocate.
- Go to Reports >> Purchase Reports >> Vendor Deposit Balance
- Select the vendor
- Select the transaction period
- Click View
Inventory Reports
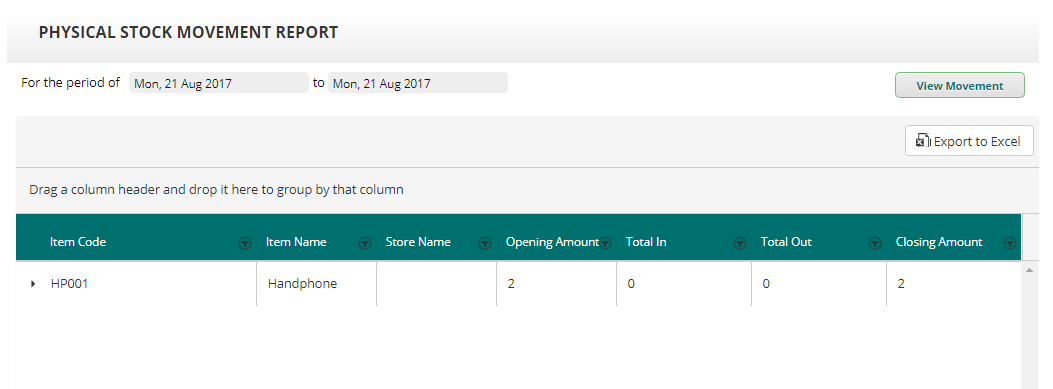
Physical Stock Movement
This report will show the user the physical stock movement, when the item goes in/out and when.
It will show the item's location, opening quantity and closing quantity for a selected period range.
To view the report, go to Reports >> Inventory >> Physical Stock Movement.
Select the period that you would like to view.
To drill down your item selection, you can filter the report via the filter function available on the table's header.

You can also export the report to excel by clicking the "Export to Excel" button on page top right.
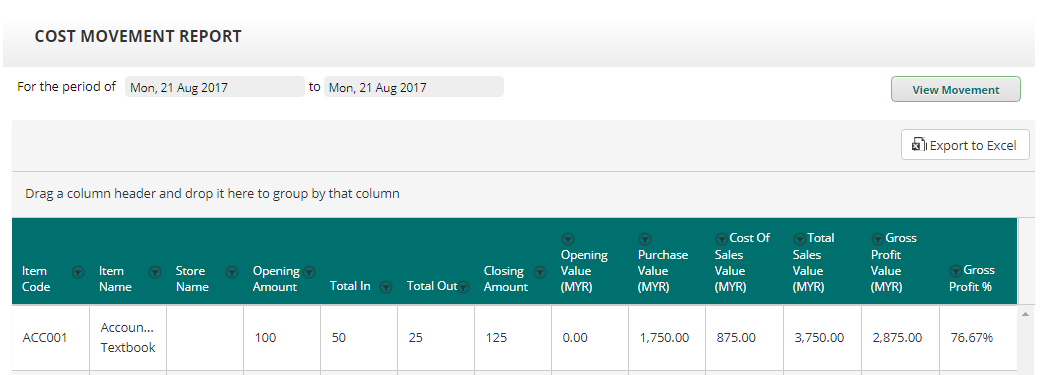
Cost Movement Report
This report will show the financial element of the stock/items available in the company
It will show the item's location, opening/closing quantity, purchase value, sales value and gross profit for each item.
To view the report, go to Reports >> Inventory >> Cost Movement Report
Select the period that you would like to view
To drill down your item selection, you can filter the report via the filter function available on the table's header

Please take note that only item which undergo the purchase and sales module will be calculated in this report. Item which bypass the process by using add quantity batch or adjust item quantity will not be calculated.
You can also export the report to excel by clicking the "Export to Excel" button on page top right.
GST
View GST Report
Move you mouse to GST >> Click on Generate GST Submission
In order to generate the report:
- Select GST Adjustment account number 4020/0003 in the ‘GST Adjustment Account’ selection
- Enter your date range from 1st of the reporting month to the last day of the reporting month e.g. 1st November 2016 to 30th November 2016
- Click on the ‘View Report’ button to generate the GST Movement report for the selected period
- Click on the ‘Generate GAF’ button to generate the GST Audit File should you are requested to do so by the Customs Department
View GST Return History
Generating a GST Submission can be done only once in Swan. Once you have generated your submission file; a GST Return History is automatically generated by the system. You cannot regenerate a GST submission for the same reporting period.
Should you make a mistake and want to correct your submission data, you can however delete this record by clicking on the ‘Delete’ icon on the specific reporting period and regenerate your submission.